
Tariffs Create Opportunity for Soybean PUT Options
Soybean PUT options: Look at this huge drop in Soybean prices basis the NOV-2018 contract. Due to recent tariff disputes – Soybeans prices have dropped nearly as much as the tariffs imposed in recent weeks. NOV18 Soybean prices have recently dropped 234.25 cents, about -22%.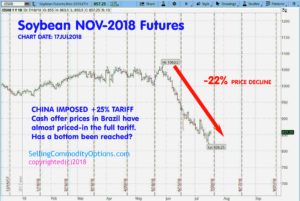
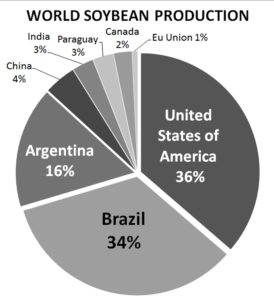
China is the largest world purchaser of soybeans. Brazil and the United States of America produce 70% of the worlds soybeans. Analysts are reporting this week that soybean prices in Brazil have priced-in the 25% tariff on USA soybeans. This strongly suggests that this huge drop in prices over the last few weeks might be reaching a bottom. From this point forward, should negotiations between China and the USA resume, there could be a nice bounce up in pricing. Even if that does NOT happen, beans may have finally reached a bottom since lower prices have effectively negated most of the tariff cost.
Learning to Trade Where Prices WON’T GO is Much Easier than Directional-Amplitude Trading
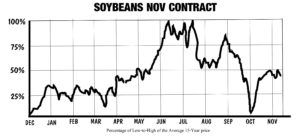
In Selling Commodity Options, we only have to portend where prices will not go; this is so much easier than directional-amplitude trading. This technique creates high-probability trades that can be selected – as you will see in the options matrix below. It seems the tariff disputes have had the effect of creating an early seasonal price bottom for the NOV-2018 contract. Here is the normal average 15-year price pattern for the NOV soybean contract. You can see the timing for seasonal low pricing of this NOV contract is usually around the first of October:
If this supposition is true, the timing could be right to SELL some far OTM PUT options on the NOV18 soybean contract. Some think it is best to select options that have at least a 90% to 95% probability of expiring worthless. Here’s the option matrix for NOV18 soybean PUTS today (below). I have highlighted in yellow, the PUT strikes between 740 and 600 (these are the $6.00 to $7.40 per bushel PUTs). The GREEN arrows mark the OI (open interests) of the 740 and the 700 strike PUTs. I always check the OI because selling an option that is very thinly (low volume) traded can get a trader “stuck” if they have to liquidate the trade quickly. The more OI and the higher the daily trading volume (not shown here), the greater the liquidity and the more efficient (fair ) prices will be.
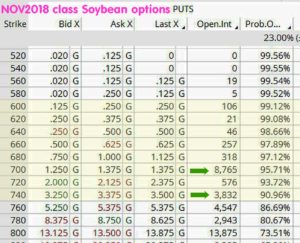
For Example: The 740-strike of the NOV18 sells for 3.25 cents (3.25 x $50 per penny = $162.50). SPAN minimum for this trade is approximately $726.75 and the option expires October 26, 2018 (about 100 days out from today.) Of course this trade is subject to additional margin requirements should the underlying’s price do down. There is a possible 22% return in about 100 days of time.
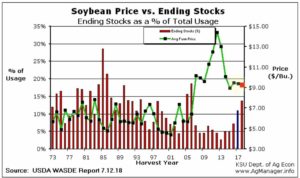
Valuable information you need to shape trading – is in the USDA’s WASDE (supply-demand) monthly reports. This chart (below) is a price versus STU (stocks-to-use ratio) historical comparison based on the WASDE. It suggests this year’s average price will be just over $9.00 per bushel. Of course, these are all projections based on historical data, the crops condition, assumed yield and other information – all subject to change. On the chart below the GREEN is the projected seasonal average price. The vertical BLUE line is this year’s crop (aka: the “old crop”) and the RED vertical line on the far right is next year’s crop (the “new crop”.) If you are not familiar with this type of chart, you should know this is just very basic supply-demand information as in economics 101. Kansas State University’s Ag Economics Dept. post this and similar charts on corn and wheat – all for free. (The credits and links are on the chart below.)
Please note how important it is that you know this type of trading is risky and it certainly not suitable for all investors. It is possible a trader could lose more money than the initial deposit requirements. Having fairly warned you, I can also say that the risks I take are very calculated; just because something is possible does not mean the same as saying it is probable. These illustrations are not to be taken as trading advice, they are here to illustrate the process I use to evaluate trades.for possible execution – as I have done for many years.
In my newsletter THE OPTION INCOME TRAINING BULLETIN, I insert the same type of information that is in this article into every single trade I feature. I am not a broker or money-manager and I do not have any get-rich-quick schemes to sell. I am a writer and educator and to my knowledge this newsletter is the only selling commodity option instructional newsletter available that is specifically for small and medium personal investors trading on-line.
If you’d like learn more about how to trade this strategy of selling commodity options, SEE THIS VIDEO NOW:
And you can get immediate access to my personal trades with a free trial subscription right now: click this button:

Thank you and good trading. – Don

Don A. Singletary