One of the best tools to help when selling cotton options, or any commodity ag options, is the PRICE-to-INVENTORY data displayed in the analysis of agricultural commodities. It exemplifies the basic economic principle of supply-demand. This article shows you an example of how to use it in an example of selling cotton options.
Cotton Production and Price
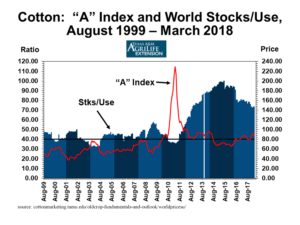
A major areas of cotton production in the United States is the state of Texas, so it isn’t surprising that a major source for information about cotton would be from the department of economics at a major university located there. (Texas A&M in this case. See the chart below:)
This article is about finding a CALL option to sell in the JULY 2018 option class. The wonderful thing about selecting an option to sell is that we only have to find a strike that is at a price where prices are not likely to go.
This is where the (above) Stocks-to-Use versus the Price data comes into play. This chart from Texas A&M’s website on cotton marketing. It displays a full 20 years of price history and an overlay of the historical STU data. Note how the prices (red line) spiked high in 2010 and 2011 when the stocks of cotton were at their lowest. The prices of course on the right margin scale, and the STU on the left margin. For 2018, the STU will be about 68% – only slightly lower than about 73% for 2017. This means that without any major disruptions in cotton delivery (causes can include drought/flood, disease, etc), we can expect cotton prices in 2018 to be very near those of 2017.
Here’s a comment posted after the recent March 2018 USDA report on the board at Texas A&M:
(the entire article can be seen HERE )“…..USDA’s March revisions of 2017/18 world cotton supply and demand were neutral in terms of month-over-month changes to ending stocks. There really weren’t that many adjustments or any large adjustments, month over month. Foreign production was raised by roughly 600,000 bales mostly from increased Australian acres and revised Sudanese balance sheet history. World cotton imports and exports were both raised 600,000 bales each, and world consumption categories were raised almost 300,000 bales. The bottom line of all this was a 300,000 bale increase in world ending stocks, month over month. Such an adjustment would be price neutral according to economic theory and history……”
Historical Cotton Prices & Selling Cotton Options
Here is another helpful chart with the 15-year price history (seasonal price tendency) of the JULY contact:
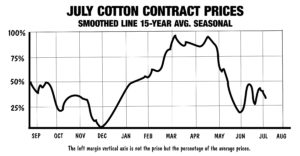
Note the price of the JULY contact has a price peak in the North American Spring season (MAR, APR, MAY) and then the price declines as planting progresses into MAY/JUN/JUL. I looked back for a chart of the JULY 2017 Cotton contract, here is the chart:
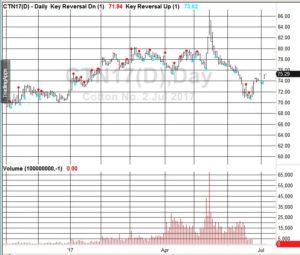
This 2017 Chart of JUL cotton follows the 15-year typical seasonal pattern of peaking in May and then declining into JUN/JUL. This year (2018) prices (see below) have peaked a little earlier than is typical. Here is the 2018 JULY cotton contract of of March 16, 2018:
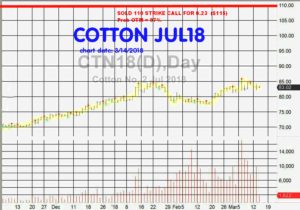
Prices are near 83 cents. Keep in mind that prices peaked around 86 last year and they could likely be a little higher than the current 83 cents, but probably not a lot higher.
I selected a strike to sell of 110 cents/pound, far above where the price for 2018 is likely to rise – based on supply-demand data. Is there a guarantee prices won’t go to 110 and higher? No, there is never a guarantee; this is why we monitor the crop progress and news during a trade. Also why we have an exit plan if our trade doesn’t work.

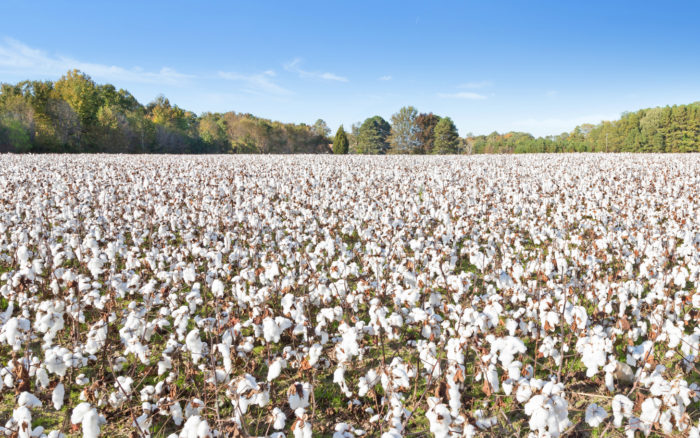
Cotton flower close up.
I did use my broker’s software to determine that the mathematical probability of this option being Out-of-the-Money(OTM) on its expiration date of June 15, 2018 of about 96%. This is often referred to as “Prob. OTM” and is a computation based on the volatility of the underlying, time until expiration, and the distance between the current price and strike-price – plus a few other factors.)
There are a few other trade considerations not covered in this short article. This type of trading can be risky and is not suitable for everyone. This article is for educational purposes and is not intended to be a trade advisory for anyone.
Free 5 Months of Trade Illustrations
If you would like to know more, you can sign up for a FREE 60-Day Trial of my newsletter: TIME FARMING TRAINING BULLETIN at: http://www.TimeFarming.com You’ll receive 3 months of back issues so you can see the ‘how and why’ of my personal trade selections, plus you’ll get the next two months of the newsletter in real time. (That’s 5 months total, plenty of time for you to evaluate the newsletter. No credit card required, just your name and email.)
One of the great advantages of learning to trade by reading the newsletter is that you will be shown how to find many sources of free information. I’ll show you how such valuable information can be used to select viable trades.
You can sign up for the free trial right now if you like:

Don A. Singletary
Thank you and good trading. – Don
