The prime reason to sell far OTM (Out-of-the-Money) options on agricultural commodities is that the annual price trends depend heavily on mother nature. Crops like wheat, corn, oats, and soybeans are of course planted each year about the same time in each growing location. By studying the amount planted (total acreage), the estimated yield (bushels per acre), along with stored supplies, and projected usage – people in the grain business can somewhat estimate what price ranges may occur in future months. The facts and projections are used to estimate supply-demand, often in the form of a STU (Stocks-to-Use Ratio.). Every month, around the 10th day of the month, the USDA updates this information – as do scores of analysts around the world. You see the term “ending stocks” used often; this is simply a supply-demand indicator used for projecting the net amount of the product available after considering crop size, storage and usage.
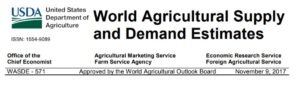 free source: USDA: https://www.usda.gov/oce/commodity/wasde/latest.pdf
“WHEAT: Projected U.S. 2017/18 ending stocks are lowered 25 million bushels due to increased exports. Recent sales to Iraq support a higher export projection with Hard Red Winter accounting for the entire increase. The latest NASS Flour Millings Products report, issued November 1, indicated only a modest increase for food use for 2016/17 and supported the current projection of 950 million bushels for 2017/18. Ending stocks are projected at 935 million bushels, down 246 million from the previous year but still above the 5-year-average. The season-average farm price is unchanged at a midpoint of $4.60.
Global 2017/18 wheat supplies are down fractionally with decreased beginning stocks but increased production. Global production is raised 0.8 million tons led by a 1.0-million-ton increase for Russia and a 0.5-million-ton increase for the EU on updated harvest results.
Partly offsetting is a 0.5-million-ton decrease for Pakistan. Exports are raised 0.6 million tons with the United States and Russia up 0.7 million, and 0.5 million, respectively. Australia exports are lowered 0.5 million. Global use is raised fractionally this month. With supplies decreasing and total use increasing, ending stocks are lowered 0.6 million tons but remain record large.”
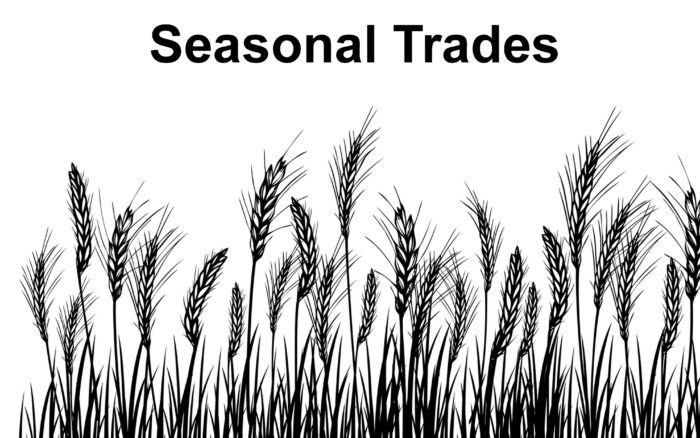
This chart is a 15-Year smoothed-line average price for the March contract of CBOT Wheat:
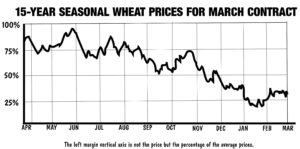 It would be naive for any of us to think we can predict the day to day price movements of a commodity. It is possible to get some educated idea of what seasonal average prices could be, based on the research. Since (at the time of this writing) it is mid-November of 2017, we can see (in the above seasonal price trend chart), that prices between now and next March-18 are neutral-to-down. When one considers this seasonal trend in context of the market fundamentals, we might portend that this information, while not telling us any day-to-day price changes, could indicate that prices are not likely to go up. To state this a different way, we could say the fundamentals of Wheat for the 2017/2018 season when viewed in the context of seasonal price tendencies, do not indicate a significant rise in prices to over $5.00 a bushel is imminent.

MAR18 CBOT WHEAT
So if you are considering selling far OTM options, probably above the 500-Strike, which strike should you sell? If you have a basic understanding of options, you know the HIGHER the strike of a CALL, the lower the price you can sell it for but the trade-off is that “the higher the strike, the less the risk” and put another way, “The lower the strike, the more money you get but the risks go higher.”
Each trader has to consider her/his unique factors: account size, risk tolerance, her interpretation of the data, the ROI (the return a trader makes when compared to the margin funds required), the amount of commissions paid – and it’s wise to determine an exit strategy in case the trade goes the wrong way. Almost everything in this list, and certainly the whole effect of these things, are largely determined by knowledge and experience of the trader. There’s also another factor that isn’t visible in my example here: Is there another trade I can do that is even better than this one? Can I do both, or must I pick one? These are all things that an experienced trader will consider.
Within days, I will probably enter a trade based on this information. When/if I do, I will describe it in my newsletter the Time Farming Training Bulletin. These types of trades (as I always remind you) are risky. Even though most of my trades have a mathematical chance of over 90% of success, they can and do go wrong. If anyone ever tells you can always win 100% of trades, that should be a red flag; they are not being truthful. I only write about real trades that I do myself in real-time; I send out the details the same day (usually after 2PM eastern time.) I am not a trade advisor, a broker, nor do I manage anybody’s money but my own accounts. I am a writer and educator and my blog and newsletter cater specifically to small/medium investors doing their own on-line trading and learning at their own pace. As far as I know, there is not another blog or newsletter that does this specifically for small and medium sized investors.
I specialize in this one type of trading and my goal is to help others learn and discover how it’s done. I publish articles here and detail trades in the Time Farming Training Bulletin. I offer a free 60-Day trial so you may consider my subscriber-based newsletter its value to you. No credit cards required, just name and email. The sign up page is here: http://www.TimeFarming.com
If you like what you see, please tell a friend; I would appreciate that.
Thank you. – Don A. Singletary
If you have questions / comments, I can be contacted at Don@WriteThisDown.com
This type of trading is detailed in my book, available on Amazon with free Prime shipping: