USDA Reports in Futures Trading
Futures trading and USDA reports go hand-in-hand. The most reliable way to keep track of crop fundamentals in the United States and the world is to take advantage of the United States Department of Agriculture’s research material. It is publicly funded and available free to all. For enhanced mobile page views click here.
One of the most popular and widely used reports is the WASDE, the World Agricultural Supply-Demand Estimates that is issued around the 10th of each month. It features multi-million dollar research on the parameters that determine both the stocks of a commodity and also on the shipments and sales of product world-wide. It also provides an estimate for the seasonal average prices in the United States for a great many commodities like Wheat, Corn, and Soybeans.
Here’s the link to the regular monthly WASDE reports, perhaps the most closely followed report of all:WASDE World Agriculture Supply-Demand Estimates. Available in PDF, Excel, and text formats.
Trading successfully depends on you finding and applying accurate information in a timely manner.
Successful trading of these crop commodities requires estimates and reports of total acreage plantings, the estimated yield, the expected usage – from feed grain to ethanol production, exports to markets, and regular updates on crop conditions. Commodity prices will often swing in reaction to crop estimates and reported plantings and crop conditions prior to harvest. These reports give you the information you need to trade them successfully.
The CME, Chicago Mercantile Exchange also lists many charts and tables based on USDA reports at these links:
CME : Chicago Mercantile Exchange:
Periodic Reports / Supply Charts / Demand Charts
Seasonal Price Patterns are Patterns for Profit
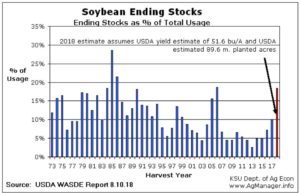
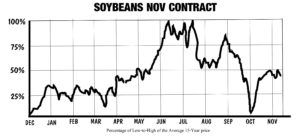
The fundamental information gathered and supplied by these very important USDA reports and the NASS, the National Agricultural Statistics Service are vital in understanding price behavior based on often periodic seasonal variation in commodity pricing. Another great tool is to gain access to these somewhat repetitive price patterns that describe normal seasonal prices in selected commodities. This chart displays the peak prices in the Northern Hemisphere Summer when crops are in the ground, and also displays how prices decline into the the fall season as harvest progresses.
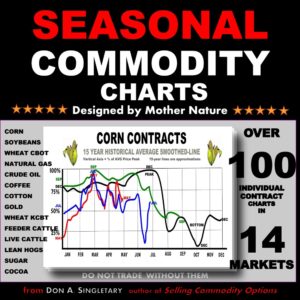
One of my books has the seasonal patterns for 14 different commodities and each of their monthly-named contracts that are traded year round. The USDA reports and a thorough knowledge of regular seasonal price patterns are both necessary in order to select trades that take the powerful forces of Mother Nature into account.
Here’s a link for the Monthly Calendar of Important USDA reports:
USDA Report Dates and Schedules CURRENT MONTHLY REPORT CALENDAR
Subscribers of my newsletter, OPTION INCOME TRAINING BULLETIN, have access to a special section I call Resources – Links Library a full list of where to find USDA, major university ag economic departments’ research and other valuable trading information. Click this button for a free two week trial offer, no credit /debit card required:
My newsletter specializes in selling commodity options and is the only newsletter of its kind – dedicated specifically to teaching small and medium traders how to create income streams using this great strategy. Pro’s and money-managers have used this strategy for years, now you can too.
Here’s the link to the Seasonal Commodity Charts – Designed by Mother Nature.
Learn why commodity options yield more than stock options in this video:
Thank you – Don

Don A. Singletary